
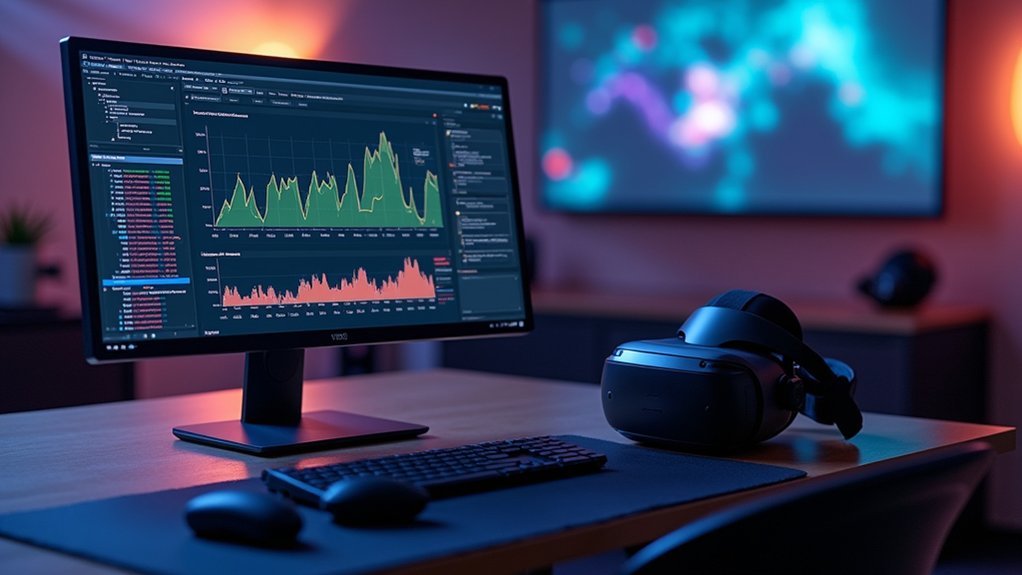
You’ll need specialized profiling tools to achieve VR’s demanding 90+ FPS requirements and eliminate motion sickness-inducing stutters. Essential options include Oculus Performance Profiler for Meta headsets, SteamVR Performance Profiler for Valve ecosystems, Unity’s built-in profiler for real-time monitoring, and Unreal Engine’s stat commands. GPU-specific tools like NVIDIA Nsight Graphics, AMD Radeon GPU Profiler, and Intel VTune Amplifier provide deeper hardware insights, while Oculus Debug Tool and Meta Quest Performance Analyzer offer platform-specific optimization capabilities that’ll transform your VR development workflow.
Oculus Performance Profiler

When developing VR applications for Oculus hardware, you’ll find the Oculus Performance Profiler an essential tool that delivers detailed insights into critical performance metrics like frame rate, CPU/GPU usage, and thermal throttling.
This SDK-included profiler enables real-time analysis of your VR applications, helping you identify and resolve performance issues that could impact user experience.
You can launch profiling sessions through the Oculus Debug Tool and monitor your application’s performance while actively interacting with the VR environment.
The Oculus Performance Profiler displays results on-screen during sessions, providing immediate feedback for your optimization efforts.
When you need deeper analysis, you can export profiling results to CSV format, allowing thorough performance metrics evaluation outside the tool for further optimization work.
SteamVR Performance Profiler
For developers targeting Valve’s VR ecosystem, the SteamVR Performance Profiler serves as your primary diagnostic tool for analyzing application performance across Steam-compatible VR headsets.
You’ll access real-time performance data that’s critical for maximizing frame timing and rendering statistics. The profiler delivers detailed insights into input latency, helping you identify bottlenecks that compromise user experience.
You can monitor both CPU and GPU usage simultaneously, enabling thorough analysis of resource consumption during runtime. The tool visualizes performance metrics, making it easier to pinpoint issues causing stuttering or lag during gameplay.
Unity Built-in Profiler
Since Unity dominates VR development, you’ll find the Unity Built-in Profiler indispensable for optimizing your virtual reality applications. This real-time performance monitoring tool provides extensive metrics for CPU, GPU, memory allocation, and script execution, making bottleneck identification straightforward.
You can analyze frame rates and draw calls directly in the Game View while running applications in the Unity editor. This immediate feedback eliminates the need for constant building and deploying during optimization. The Frame Debugger complements the Profiler by examining draw call sequences and pinpointing rendering issues.
| Feature | Capability |
|---|---|
| CPU/GPU Metrics | Real-time performance monitoring |
| Memory Analysis | Allocation and usage tracking |
| Remote Profiling | Meta Quest headset support via adb/WiFi |
| Frame Debugging | Draw call order examination |
| Editor Integration | Live performance feedback |
Unreal Engine Stat Commands
You’ve got powerful built-in tools at your disposal with Unreal Engine’s Stat Commands, which deliver real-time performance metrics directly within your VR development environment.
These essential commands like `stat fps`, `stat unit`, and `stat memory` let you instantly monitor frame rates, identify rendering bottlenecks, and track memory usage without disrupting your workflow.
Essential Stat Commands
When you’re developing VR applications in Unreal Engine, stat commands serve as your frontline tools for real-time performance monitoring.
You’ll find `stat fps` essential for tracking frame rates, which is vital for preventing motion sickness in Oculus headsets. The `stat unit` command breaks down frame time into detailed components, helping you identify CPU versus GPU bottlenecks. Use `stat memory` to monitor allocation patterns and prevent crashes during intensive scenes.
Profiler displays complement these commands by providing visual representations of your data. You can enter these commands directly into the console during gameplay, enabling immediate identification of performance issues.
Combining multiple stat commands creates thorough monitoring setups that pinpoint high latency or excessive draw calls, ultimately delivering smoother VR experiences.
Real-Time Performance Analysis
Building on these foundational commands, real-time performance analysis through Unreal Engine’s stat system transforms raw data into actionable insights for VR optimization.
You’ll leverage stat fps to maintain consistent frame rates, ensuring your VR application meets the demanding 90+ FPS requirements that prevent motion sickness. The performance Head-Up display provides immediate visual feedback, allowing you to spot frame drops and stutters as they occur during gameplay testing.
You can simultaneously monitor multiple metrics by combining commands like `stat unit` and `stat memory`, creating a thorough performance overview.
This real-time approach enables you to make immediate adjustments to lighting, geometry complexity, or texture resolution while observing their direct impact on performance metrics, streamlining your optimization workflow considerably.
Optimization Workflow Integration
Since effective VR optimization requires continuous monitoring throughout development cycles, integrating Unreal Engine’s stat commands into your workflow transforms performance analysis from a reactive troubleshooting task into a proactive development practice.
You’ll maximize efficiency by establishing structured checkpoints throughout your optimization workflow:
- Feature Implementation Checks – Run `stat FPS` and `stat SCENE` after adding new assets or mechanics to immediately identify performance impacts before they compound.
- Build Milestone Analysis – Combine stat commands with external profiling tools during major build reviews to create thorough performance baselines and track optimization progress.
- Pre-Release Validation – Execute systematic stat command sweeps across all VR environments to guarantee frame timing consistency and identify any remaining bottlenecks before deployment.
This integration guarantees your profiling tools work seamlessly together, maintaining ideal VR performance standards.
NVIDIA Nsight Graphics
You’ll find NVIDIA Nsight Graphics particularly valuable for analyzing your VR application’s GPU pipeline performance in real-time.
The tool’s GPU pipeline analysis capabilities let you inspect each stage of the rendering process, from vertex processing to pixel output, helping you identify exactly where bottlenecks occur.
Its VR optimization features provide specialized metrics and visualizations specifically designed to address the unique performance challenges of virtual reality applications.
GPU Pipeline Analysis
When developing VR applications on NVIDIA hardware, Nsight Graphics becomes your primary weapon for dissecting GPU performance bottlenecks. This GPU profiler delivers exhaustive pipeline analysis through frame capture and detailed rendering statistics that reveal exactly where your application struggles.
You’ll gain critical insights through three essential analysis capabilities:
- Draw Call Inspection – Track individual rendering commands and their performance impact across the entire pipeline.
- Real-time Performance Overlays – Monitor GPU utilization, frame times, and CPU metrics during live application execution.
- Shader Debugging Integration – Trace rendering commands while analyzing shader performance for targeted optimizations.
The tool’s tight integration with NVIDIA’s architecture enables hardware-specific optimizations that maximize your VR application’s rendering efficiency and maintain the consistent frame rates VR demands.
VR Optimization Features
Beyond standard profiling capabilities, Nsight Graphics delivers specialized VR optimization features that directly address the unique performance challenges of virtual reality development.
You’ll find a dedicated VR-specific mode that evaluates critical rendering metrics, guaranteeing your VR applications meet performance benchmarks essential for comfortable user experiences. The tool’s real-time monitoring helps you identify bottlenecks like high GPU utilization and rendering latency that can break VR immersion.
NVIDIA Nsight Graphics leverages hardware integration through GPU Trace and Frame Profiler, providing deep insights into GPU performance efficiency.
You can capture frames to inspect rendering commands, textures, and shaders at each pipeline stage, enabling targeted optimizations. This extensive approach guarantees your VR applications maintain the smooth performance necessary for preventing motion sickness and delivering seamless virtual experiences.
RenderDoc Graphics Debugger
RenderDoc stands as one of the most powerful open-source graphics debuggers available to VR developers, offering extensive analysis capabilities across Direct3D, Vulkan, OpenGL, and OpenGL ES APIs.
You’ll discover detailed insights into every stage of your graphics pipeline, enabling precise enhancement of frame rates and thorough examination of draw calls.
The tool’s all-encompassing debugging features include:
- Frame capture functionality that lets you step through individual draw calls and observe real-time changes to graphics settings and shader modifications.
- Resource monitoring displaying texture usage, state changes, and performance metrics through an intuitive interface.
- Bottleneck identification helping you pinpoint rendering inefficiencies that impact VR performance across different hardware platforms.
You’ll find RenderDoc invaluable for achieving ideal visual fidelity while maintaining the demanding performance requirements essential for immersive VR experiences.
Intel VTune Amplifier
You’ll need Intel VTune Amplifier when your VR application demands precise CPU performance analysis and optimization specifically for Intel processors.
This profiler excels at identifying performance bottlenecks through hotspots analysis and threading insights that can make or break your VR experience’s frame rates.
VTune’s deep analytical capabilities give you granular visibility into how your VR code actually executes on Intel hardware, revealing optimization opportunities that generic profilers often miss.
CPU Performance Analysis
When developing VR applications, you’ll need precise CPU performance insights to identify bottlenecks that can cause frame drops and motion sickness.
Intel VTune Amplifier delivers thorough CPU performance analysis through three essential capabilities:
- Hotspots Analysis – Pinpoints functions consuming the most CPU cycles, allowing you to focus optimization efforts where they’ll have maximum impact on your VR application’s responsiveness.
- Concurrency Analysis – Examines how effectively your application utilizes multiple CPU cores, revealing threading inefficiencies that could compromise performance in resource-intensive VR environments.
- Real-time Performance Tracking – Integrates with development environments to provide immediate feedback during execution, enabling you to analyze and improve code efficiency as you build.
These detailed insights into CPU utilization, thread activity, and memory access patterns help you enhance VR application performance and reduce latency.
Intel Processor Optimization
Since Intel VTune Amplifier leverages Intel’s deep processor architecture knowledge, it provides unparalleled optimization insights for VR applications running on Intel hardware.
You’ll discover performance bottlenecks across both CPU and GPU workloads through its specialized analysis types. The Hotspots analysis pinpoints time-consuming code sections, while Concurrency analysis reveals threading inefficiencies that plague VR applications requiring consistent frame rates.
You can choose between sampling and instrumentation methods depending on your specific profiling requirements. The tool’s visualization features display CPU utilization and memory bandwidth graphically, making complex performance data digestible.
VTune’s seamless integration with development environments enables real-time profiling without workflow disruption, allowing you to identify and fix performance issues immediately while maintaining your development momentum.
Deep VR Insights
While general performance profiling provides surface-level metrics, Intel VTune Amplifier’s specialized VR analysis mode delivers unprecedented visibility into the intricate performance dynamics that make or break immersive experiences.
You’ll gain access to three critical profiling modes that transform your performance analysis:
- Hotspots Analysis – Identifies CPU-intensive code sections consuming excessive processing power during frame rendering.
- Threading Concurrency – Reveals how your VR application’s threads interact and compete for system resources.
- Memory Access Patterns – Exposes bottlenecks in data flow that cause frame drops and motion sickness.
Intel VTune Amplifier’s detailed graphs and charts translate complex performance data into actionable insights.
You’ll visualize exactly where your application struggles to maintain the critical 90fps threshold.
The tool’s integration with development environments streamlines optimization workflows, letting you iterate quickly between profiling and code improvements for smoother VR experiences.
AMD Radeon GPU Profiler
Although VR development demands precise GPU performance analysis, the AMD Radeon GPU Profiler delivers extensive insights specifically tailored for graphics-intensive applications. You’ll gain detailed rendering pipeline visibility, identifying performance bottlenecks in shaders, textures, and memory usage that impact your VR experiences.
The profiler captures GPU frames while providing thorough data on utilization, frame timing, and draw call performance. You can leverage Frame Profiling features to examine individual frames and understand how different rendering techniques affect performance.
| Feature | Benefit | VR Application |
|---|---|---|
| GPU Frame Capture | Real-time analysis | Smooth headset tracking |
| Pipeline Visualization | Bottleneck identification | Reduced motion sickness |
| Memory Profiling | Optimization insights | Stable framerates |
Through systematic performance tuning, you’ll achieve smoother frame rates and enhanced user experiences in your VR applications.
Oculus Debug Tool
When developing VR applications for Oculus hardware, you’ll find the Oculus Debug Tool provides targeted performance insights that complement broader GPU profiling solutions.
This specialized utility, included with the Oculus SDK, offers performance profiling capabilities designed specifically for VR environments.
You can access the tool by accessing Program FilesOculusSupportoculus-diagnostics and launching OculusDebugTool.exe.
The Performance Profiler mode delivers thorough monitoring capabilities:
- Real-time metrics tracking – Monitor frame rate, CPU/GPU usage, and thermal throttling during application execution
- Direct application profiling – Launch and analyze your VR applications within the tool’s environment
- Data export functionality – Export results to CSV format for detailed analysis and optimization planning
These insights help you identify performance bottlenecks and enhance user experience.
Meta Quest Performance Analyzer
Since Meta Quest devices operate as standalone VR systems, you’ll need specialized tools that account for their unique hardware constraints and mobile-based architecture.
The Meta Quest Performance Analyzer delivers real-time monitoring specifically designed for these devices, tracking critical metrics like frame rate, CPU/GPU usage, and thermal throttling.
Real-time performance monitoring built specifically for Quest hardware delivers essential metrics including frame rates, CPU/GPU usage, and thermal data.
You’ll find the Performance Head-Up Display particularly valuable, as it visually shows render timings and performance headroom during runtime.
The included OVR Metrics Tool reports essential data on frame rates, heat levels, and throttling events. You can export profiling results for deeper analysis, examining performance statistics across various application scenarios.
This performance analyzer enables systematic optimization approaches, helping you identify bottlenecks and guarantee smoother, more immersive VR experiences.
Frequently Asked Questions
What Are Performance Profiling Tools?
You’ll use performance profiling tools to monitor and analyze your software applications’ runtime behavior. They’ll help you identify bottlenecks, measure resource usage, and optimize code efficiency by tracking metrics like CPU usage and memory consumption.
What Is VR Performance Kit?
You’ll use VR Performance Kit as a thorough collection of optimization tools and resources. It’ll help you analyze CPU/GPU usage, frame rates, and latency while identifying rendering bottlenecks in your virtual reality applications.
What Are the Best Settings for VR Performance?
You’ll want to target 72+ FPS, use instanced meshes to reduce draw calls, limit shader variants, stay within triangle count budgets for your target headset, and disable multithreaded rendering while debugging.
What Software Is Used for Virtual Reality?
You’ll use Unity or Unreal Engine as your primary development platforms for creating VR applications. You’ll also need SteamVR, Oculus SDK, or OpenXR for hardware integration and runtime support.
Leave a Reply