You’ll revolutionize your scientific research with powerful MR data visualization tools like ParaView, VTK, and cloud-based platforms that transform complex datasets into interactive 3D environments. These advanced systems enable real-time manipulation of molecular structures and anatomical features through gesture controls, while AI-driven algorithms accelerate processing speeds for quicker decision-making. Collaborative features allow your research team to simultaneously analyze findings across multiple locations, enhancing diagnostic accuracy and revealing hidden patterns in challenging datasets that traditional methods can’t uncover.
Understanding Mixed Reality Data Visualization in Scientific Research

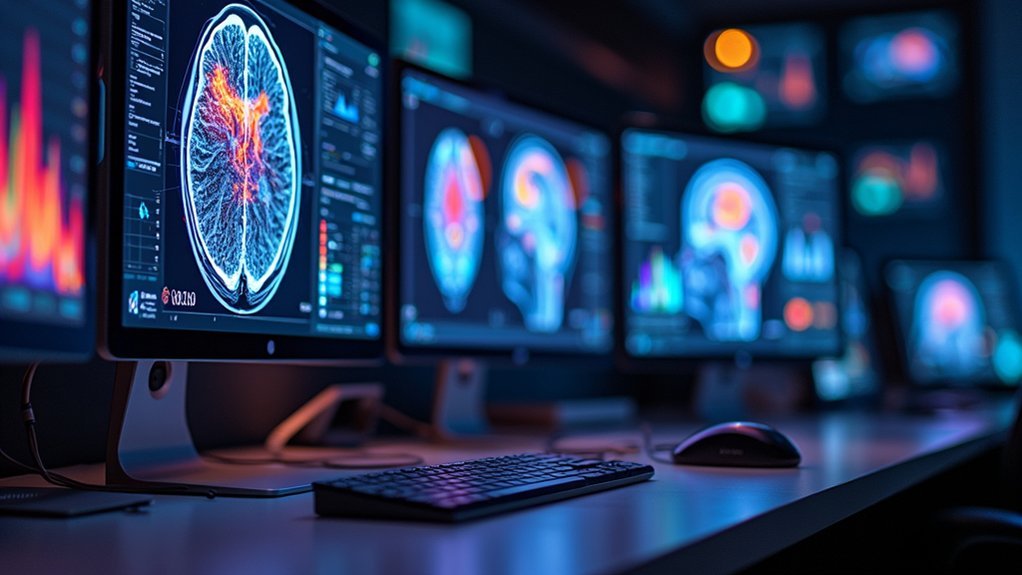
While traditional 2D screens limit your ability to grasp complex scientific relationships, mixed reality data visualization transforms how you’ll interact with research data by seamlessly blending digital information with your physical environment.
You’ll manipulate three-dimensional models of scientific data through intuitive gestures and voice commands, creating a more engaging experience than conventional displays offer.
Mixed Reality enables you to visualize spatial datasets in real-time, whether you’re examining medical imaging results, environmental simulations, or molecular structures.
This technology facilitates collaborative analysis across remote locations, allowing research teams to explore the same data visualization simultaneously.
You’ll gain deeper insights into complex datasets while making faster, more informed decisions throughout your research process, fundamentally changing how scientific discovery unfolds.
Essential MR Visualization Software for Complex Datasets
When you’re working with complex MR datasets, you’ll need specialized software platforms that can handle the computational demands of advanced processing and visualization.
Interactive volume rendering tools become essential for exploring three-dimensional structures within your data, allowing you to manipulate viewing angles and opacity settings in real-time.
Multi-dimensional dataset analysis capabilities enable you to examine temporal changes, functional correlations, and spatial relationships that traditional 2D viewing methods simply can’t reveal.
Advanced MR Processing Platforms
As MR imaging datasets grow increasingly complex and voluminous, you’ll need specialized processing platforms that can handle the computational demands and visualization requirements of modern medical imaging research. These advanced platforms deliver the computational power and sophisticated algorithms necessary for processing large-scale MR data effectively.
| Platform | Type | Key Strengths |
|---|---|---|
| ParaView | Open-source visualization | 3D volume manipulation, parallel processing |
| VTK | Development toolkit | Customizable algorithms, cross-platform support |
| VisIt | Interactive scientific tool | Scalable rendering, complex datasets analysis |
| Looker | Cloud-based platform | Data modeling, Google cloud integration |
| Python libraries | Programming framework | Matplotlib/Seaborn flexibility, custom solutions |
These data visualization tools provide the foundation for handling sophisticated MR imaging workflows, enabling researchers to extract meaningful insights from increasingly complex datasets.
Interactive Volume Rendering Tools
Building on these foundational platforms, interactive volume rendering tools transform how you visualize and manipulate three-dimensional MR datasets in real-time.
These data visualization tools enable you to explore complex anatomical structures through dynamic manipulation, adjusting viewing angles and slicing through volumetric data seamlessly. Software like ParaView and VTK provides real-time rendering capabilities using advanced algorithms that represent 3D data as continuous volumes.
You’ll achieve high-fidelity visual representations of gradients, textures, and densities within your MRI scans. Interactive volume rendering allows you to apply customizable color maps and opacity settings, enhancing visibility of specific features like tumors or anatomical structures.
When combined with machine learning techniques, these tools greatly improve pattern identification and anomaly detection in MRI datasets, facilitating superior diagnostic outcomes.
Multi-dimensional Dataset Analysis
While volume rendering establishes the foundation for 3D visualization, multi-dimensional dataset analysis demands specialized software that can handle the complexity of high-dimensional MRI data with temporal, spectral, and functional components.
You’ll need robust data visualization tools that extend beyond basic 3D rendering capabilities. Professional medical imaging applications leverage sophisticated algorithms to process multi-dimensional datasets effectively, revealing hidden patterns and relationships within your MRI data.
Essential software options include:
- ParaView and VTK – Handle complex volumetric data manipulation with advanced filtering capabilities
- MATLAB/Python libraries – Enable custom algorithm development for specialized analysis workflows
- Looker and Tableau – Provide interactive dashboards for large dataset integration and insights
- 3D rendering platforms – Offer perceptually uniform color mapping for enhanced clarity and accessibility
These tools guarantee you can extract meaningful insights from complex multi-dimensional medical imaging datasets.
Interactive 3D Modeling Tools for Scientific Applications
When you’re working with complex MR datasets, interactive 3D modeling tools like ParaView and VTK transform your visualization capabilities through advanced volume rendering techniques.
You’ll gain the ability to manipulate multi-dimensional data in real-time, allowing you to explore anatomical structures and extract surface details that static visualizations can’t provide.
These tools enable you to create customizable graphical representations that respond instantly to your input, making data interpretation more intuitive and thorough.
Advanced Volume Rendering
As scientists grapple with increasingly complex three-dimensional datasets from MRI scans and other imaging modalities, advanced volume rendering has emerged as a critical technique for visualizing internal structures without requiring invasive procedures.
You’ll find these powerful visualization tools transform raw volumetric data into comprehensible visual representations, enabling deeper exploration of complex anatomical features.
Modern data visualization platforms leverage several key capabilities:
- GPU acceleration through tools like ParaView and VTK for handling massive datasets interactively
- Surface rendering methods that convert volumetric data into accurate 3D anatomical representations
- Customizable modeling features in software like Looker and MATLAB for multi-dimensional analysis
- Machine learning integration for improved diagnostic accuracy through enhanced feature extraction
These advanced volume rendering techniques revolutionize how you analyze medical imaging data.
Real-Time Data Interaction
Through interactive 3D modeling tools like ParaView and VTK, you can manipulate and explore MR data in real-time, transforming static visualizations into dynamic research environments.
These powerful platforms enable real-time manipulation of large-scale datasets, allowing you to render MRI and CT scans with exceptional clarity and detail.
You’ll experience immersive experiences through intuitive controls that let you rotate, zoom, and slice through complex data structures.
This interactive approach reveals hidden patterns and relationships within your scientific datasets that static images can’t capture.
Advanced features like customizable color mapping and volumetric rendering help you highlight specific data attributes for enhanced analysis.
When integrated with cloud services such as Google Cloud’s BigQuery, these visualizations become scalable and shareable across research teams, promoting seamless collaboration and improved accessibility for distributed scientific workflows.
Real-Time Data Processing Capabilities in MR Environments

While traditional MRI analysis requires time-consuming post-processing workflows, real-time data processing capabilities in MR environments revolutionize how you interact with imaging data by enabling immediate visualization and manipulation of complex datasets.
These real-time data processing systems enhance diagnostic accuracy by eliminating delays between data acquisition and analysis.
Advanced visualization tools like ParaView and VTK transform sequential 2D MRI slices into thorough 3D volumes you can manipulate instantly.
Key capabilities include:
- AI-driven algorithms that expedite imaging data processing for quicker clinical decision-making
- Dynamic parameter manipulation allowing real-time observation of changes
- Enhanced user interactivity for better patient outcomes
- Cloud-based platforms like Looker enabling collaborative analysis from multiple locations
You’ll experience improved efficiency as these tools process large datasets immediately, supporting simultaneous multi-user access for thorough collaborative analysis.
Spatial Data Representation Techniques for Research
You’ll maximize data visibility through perceptually uniform color maps that enhance pattern recognition while ensuring accessibility for color-blind researchers.
Interpolation and contour mapping techniques help you visualize continuous spatial phenomena, revealing gradients and shifts within your datasets more intuitively.
Advanced platforms like ParaView and VTK function as powerful analysis tool options, allowing interactive manipulation of large scientific datasets.
These spatial data visualization solutions facilitate deeper exploration and enable more accurate interpretation of your research findings.
Cross-Platform MR Visualization Solutions

When you’re working with MR data across multiple platforms, you’ll need solutions that maintain consistent performance whether you’re using Windows, macOS, or Linux systems.
Your visualization tools must handle rendering efficiently across different devices while supporting universal data formats that don’t lock you into proprietary ecosystems.
You’ll want to guarantee your chosen platform can seamlessly process standard formats like DICOM, NIfTI, and VTK while delivering reliable performance on everything from high-end workstations to mobile devices.
Platform Compatibility Requirements
As scientific research becomes increasingly collaborative across institutions and geographic boundaries, platform compatibility emerges as a critical factor in selecting MR visualization tools.
You’ll need solutions that work seamlessly across Windows, macOS, and Linux environments to guarantee your entire research team can access and analyze data effectively.
When evaluating platform compatibility, consider these essential requirements:
- Operating system support – Verify tools run natively on your team’s preferred platforms
- Hardware requirements – Check minimum specifications for graphics cards and processing power
- Network connectivity – Confirm stable internet access for cloud-based analytics solutions
- Browser compatibility – Confirm web-based tools function across different browsers
Open source software like VTK provides exceptional cross-platform flexibility, while cloud-based analytics tools eliminate many compatibility concerns entirely.
You’ll maximize collaboration efficiency by prioritizing platform compatibility during your tool selection process.
Multi-Device Rendering Performance
While platform compatibility guarantees your team can access MR visualization tools, delivering consistent performance across multiple devices presents an entirely different challenge.
You’ll need multi-device rendering performance that maintains visual fidelity whether you’re using high-end workstations or smartphones. Cloud-based technologies become your powerful tool for guaranteeing real-time updates and seamless interactions across all platforms.
Unity and Unreal Engine offer robust rendering capabilities that adapt to different hardware specifications without compromising your visualization design.
You can implement responsive design principles that automatically adjust layouts based on screen sizes, optimizing readability and interaction. WebXR API support enables browser-based deployment, eliminating software installation requirements while maintaining performance standards.
This approach guarantees your scientific data visualizations remain accessible and functional regardless of your team’s device preferences.
Universal Data Format Support
Beyond ensuring smooth performance across devices, you’ll encounter the fundamental challenge of working with diverse MR data formats that must integrate seamlessly within your visualization pipeline.
Universal data format support becomes critical when you’re handling multiple imaging standards and need consistent analysis workflows.
Modern data visualization tools address this challenge through all-encompassing format compatibility:
- NIfTI and DICOM integration – Native support for standard medical imaging formats
- Cross-platform libraries – ParaView and VTK enable seamless data exchange
- Open-source solutions – VisIt and MATLAB handle large data processing efficiently
- Cloud-based collaboration – Share insights across different platforms and devices
You’ll maintain data integrity while shifting between applications, streamlining your analysis process without platform restrictions limiting your research capabilities.
Cloud-Based Analytics for Scientific MR Applications
When you’re dealing with massive scientific MR datasets, cloud-based analytics platforms like Google Data Studio and Looker transform how you visualize and process complex magnetic resonance information.
These data visualization tools seamlessly integrate with Google Drive and BigQuery, enabling effortless collaboration across research teams without requiring extensive local infrastructure.
You’ll leverage advanced computing resources for complex processing while creating interactive dashboards through user-friendly interfaces that don’t demand extensive coding skills.
The scalability guarantees you can efficiently manage growing datasets and incorporate real-time updates for continuous monitoring.
Cloud-based analytics platforms provide the computational power and flexibility you need to handle large-scale MR data analysis, making sophisticated visualization accessible regardless of your technical background or institutional infrastructure limitations.
Collaborative Research Features in MR Visualization Platforms
Building on these cloud-based capabilities, collaborative features in MR visualization platforms enable research teams to work together seamlessly on complex magnetic resonance data projects.
You’ll find that platforms like ParaView and VisIt offer real-time annotation and commenting capabilities, allowing multiple researchers to analyze and discuss findings simultaneously.
Modern visualization tools provide several key collaborative advantages:
- Real-time editing – Multiple team members can modify interactive dashboards simultaneously across different locations.
- Direct invitation systems – Platforms like Google Data Studio let you invite collaborators for immediate access and feedback.
- Version control – Track all changes made by team members and revert to previous versions when needed.
- Secure sharing – Advanced security settings protect sensitive MR data while enabling authorized access.
These features streamline iterative research processes and enhance teamwork efficiency.
Advanced Rendering Techniques for Scientific Data
As research datasets grow increasingly complex, advanced rendering techniques transform how you’ll visualize and interpret scientific MR data.
Volume rendering converts sequential 2D slices into cohesive 3D representations, essential for analyzing MRI and CT scans effectively. You’ll benefit from ray casting methods that project rays through volume data, determining pixel colors based on density to improve clarity across data layers.
Volume rendering transforms flat 2D medical scans into comprehensive 3D visualizations, dramatically enhancing diagnostic accuracy and spatial understanding.
Surface rendering techniques create detailed meshes outlining complex structures like protein molecules, enabling better shape and form analysis.
Dynamic shaders add realistic lighting and texturing, providing vital depth for interpreting intricate scientific data visualization.
Specialized tools like ParaView and VTK offer customizable options for large datasets, ensuring you achieve precise, informative representations that enhance your scientific analysis capabilities.
Integration Methods for Existing Research Workflows
Since most research teams already have established data processing pipelines, you’ll need visualization tools that seamlessly integrate without disrupting your current workflow.
Integrating scientific MR data visualization requires strategic selection of compatible platforms and tools.
- API-Based Integration: ParaView and VTK support various data formats and connect easily through APIs or data pipelines.
- Python Library Implementation: Matplotlib and Seaborn enable customizable visualizations tailored to specific research datasets within existing workflows.
- Cloud-Based Collaboration: Platforms like Looker and Google Data Studio facilitate real-time collaboration while maintaining data security.
- Direct Data Source Connection: Tools that integrate with Google Analytics or BigQuery improve speed and accuracy of data-driven research decisions.
These data visualization tools streamline converting raw MR data into meaningful insights without workflow disruption.
Performance Optimization for Large-Scale Scientific Datasets
When dealing with large-scale scientific MR datasets, you’ll encounter considerable performance bottlenecks that can severely impact your research timeline and visualization capabilities. Performance optimization becomes essential for handling these massive datasets efficiently.
| Strategy | Benefit |
|---|---|
| Parallel Processing | Reduces computation time through multi-core processing |
| Sparse Matrices | Enhances memory usage and access speed |
| Cloud Platforms | Provides scalable storage without infrastructure limits |
| Data Compression | Minimizes storage footprint and improves transfer speeds |
You’ll find that implementing efficient data structures markedly improves your visualization tools’ responsiveness. Cloud-based platforms like AWS offer scalable resources for managing large-scale datasets without local hardware constraints. Advanced libraries such as ParaView utilize GPU acceleration for real-time interaction, while compression algorithms streamline data handling throughout your visualization workflow.
Customization Options for Research-Specific Requirements
Research demands often require visualization approaches that standard tools can’t accommodate, making customization capabilities essential for scientific MR data analysis.
You’ll find that leading data visualization tools offer extensive flexibility to match your specific research requirements.
You can leverage several powerful customization features:
- Python libraries like Matplotlib and Seaborn enable bespoke visualization development for custom data formats.
- Scripting capabilities in VisIt and MATLAB automate repetitive tasks while integrating unique visual attributes.
- Advanced modeling tools such as Looker create custom visualizations aligned with your unique datasets.
- User-defined color mapping through ColorBrewer enhances clarity by matching visual context to research needs.
These highly customizable options guarantee you’re not constrained by default settings, allowing precise tailoring of visual outputs to your analytical objectives and data characteristics.
Future Developments in Scientific MR Visualization Technology
While current customization capabilities provide substantial flexibility for today’s research needs, emerging technologies promise to revolutionize how you’ll visualize and interact with MR data.
Artificial intelligence and machine learning algorithms will enhance data visualization through faster, more accurate image reconstruction. You’ll benefit from enhanced color mapping techniques that improve perceptual uniformity, making subtle tissue changes easier to identify.
Enhanced AI algorithms will deliver faster, more precise MR image reconstruction with improved color mapping for better tissue differentiation.
Cloud computing advances will enable real-time data processing and seamless sharing across institutions, fostering collaborative research.
You’ll experience immersive anatomical exploration through augmented and virtual reality integration. Multi-modal imaging techniques will combine MR data with PET or CT scans, providing thorough biological process views.
These developments will dramatically improve diagnostic accuracy while reducing processing times for your research workflows.
Frequently Asked Questions
What Are the 5 C’s of Data Visualization?
You’ll apply five essential principles when creating effective data visualizations: Clarity guarantees easy understanding, Conciseness avoids overwhelming viewers, Context provides necessary background, Consistency maintains cohesive design, and Color highlights trends accessibly.
What Is a Powerful Tool for Data Visualization?
You’ll find Tableau exceptionally powerful for data visualization, offering intuitive drag-and-drop interfaces and interactive dashboards. It transforms complex datasets into compelling visual stories that’ll help you uncover insights and communicate findings effectively to any audience.
What Are the 7 Stages of Data Visualization?
You’ll follow seven stages: define your purpose, collect and process data, choose visualization techniques, design the visual, implement it, evaluate effectiveness, and communicate insights to stakeholders.
What Tools Do Scientists Use to Help Visualize Their Ideas?
You’ll find scientists using ParaView and VTK for complex 3D data, Python’s Matplotlib for custom plots, Looker for large datasets, and Datawrapper for interactive visuals without coding requirements.
Leave a Reply