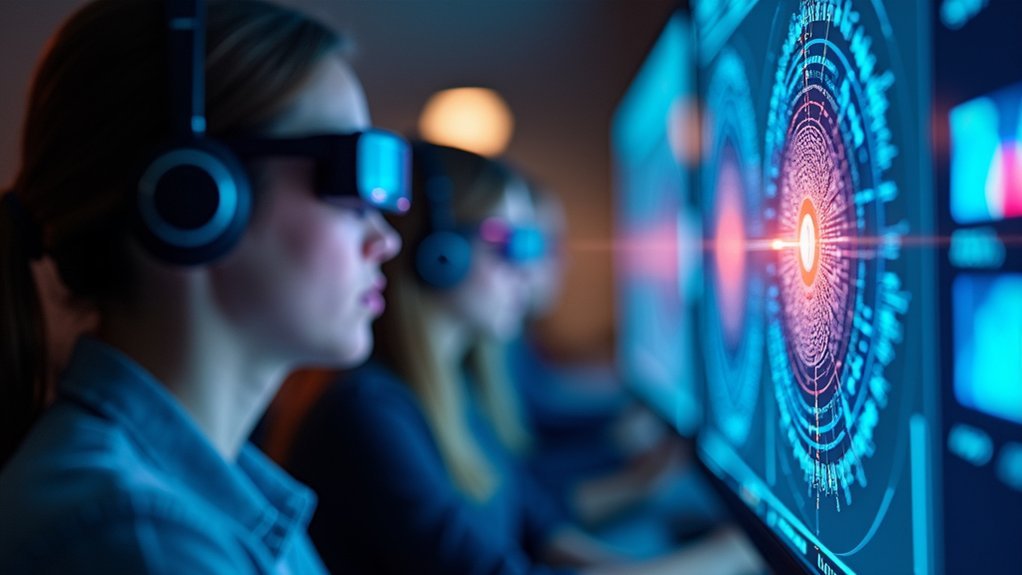
Your eye movements reveal critical performance insights through several key metrics. Fixation duration shows how deeply you’re processing information—longer fixations indicate complex cognitive demands. Saccadic frequency and velocity reflect your visual processing speed, while gaze paths expose navigation efficiency or confusion points. Pupil dilation measures cognitive load in real-time, ranging from 2-8mm based on mental effort. Blink rates drop up to 50% during intense focus, and Areas of Interest tracking identifies which elements capture your attention most effectively, revealing optimization opportunities ahead.
Fixation Duration Analysis in VR Environments
Fixation duration serves as a fundamental metric for understanding how users interact with virtual reality environments. When you’re analyzing VR experiences, you’ll notice that longer fixation durations typically indicate heightened engagement with specific virtual elements.
Complex visual scenes will increase your users’ processing time, resulting in extended fixations as they decode intricate information.
You can leverage first fixation duration to identify salient cues within your VR environment. Longer initial fixations suggest users find those elements particularly engaging or relevant to their tasks.
By examining total fixation duration across different Areas of Interest, you’ll discover which components capture attention most effectively.
These eye-tracking metrics inform critical design decisions, helping you optimize virtual environments for better user engagement and task performance.
Gaze Path Patterns During Virtual Tasks
When you analyze gaze path patterns during virtual tasks, you’ll discover how your visual attention flows sequentially through different interface elements and spatial locations.
Your scanning behavior directly impacts task completion efficiency, as ideal gaze paths minimize unnecessary eye movements and reduce cognitive load.
Sequential Attention Flow Analysis
As users navigate virtual environments, their gaze patterns create a detailed roadmap of visual attention that reveals far more than simple eye movements.
Sequential attention flow analysis transforms raw Eye Tracking Metrics into actionable insights by examining how your visual attention shifts systematically across each Area of Interest during task completion.
You’ll discover that tracking fixation sequences exposes inefficient navigation patterns and identifies confusion points where users hesitate or backtrack.
These gaze paths vary considerably between expert and novice users, revealing how experience shapes attention distribution strategies.
When you analyze sequential flows, you’re fundamentally mapping cognitive processes in real-time.
This data directly informs interface redesigns by highlighting which elements interrupt smooth task progression and which areas facilitate efficient visual scanning patterns.
Task Completion Efficiency Patterns
Gaze path patterns during virtual tasks function as diagnostic tools that expose the underlying efficiency of your cognitive processing strategies.
When you’re completing tasks, shorter paths between gaze points indicate streamlined navigation, while erratic movements suggest confusion or uncertainty. Your fixation patterns reveal expertise levels—experienced users demonstrate fewer, more purposeful fixations compared to novices who scatter their attention.
Extended fixation durations signal increased cognitive load, highlighting moments where you’re wrestling with complex decisions or encountering interface obstacles. These patterns create visual fingerprints of your thought processes, enabling researchers to pinpoint exactly where task completion breaks down.
Saccadic Movement Frequency and Velocity

Between fixations, your eyes execute rapid movements called saccades, and tracking their frequency reveals how quickly you process visual information and shift attention across a scene.
When you’re facing complex visual tasks, your saccadic movements increase in frequency as cognitive load rises, forcing you to rapidly gather information from multiple areas.
Your saccade velocity, measured in degrees per second, directly reflects your visual processing efficiency.
The speed at which your eyes dart between focal points serves as a direct measure of how efficiently your brain processes visual data.
If you’re experienced in a particular domain, you’ll demonstrate faster saccadic velocities compared to novices, indicating more streamlined information gathering.
Conversely, when you encounter confusing content, your saccades become less frequent and slower, signaling difficulty in understanding what you’re viewing.
These patterns provide clear insights into your engagement levels and task comprehension.
Pupil Dilation Response to VR Stimuli
You’ll find that pupil dilation serves as a reliable indicator of cognitive load when you’re maneuvering through VR environments, with larger diameters signaling increased mental effort and emotional engagement.
Your pupil size measurements can range from 2–8 mm, and modern eye tracking systems capture these changes with remarkable accuracy during immersive experiences.
When you’re exposed to different VR stimuli, your pupil response patterns reveal distinct signatures that correspond to varying levels of focus, stress, and overall engagement with the virtual content.
VR Cognitive Load Indicators
When you’re traversing complex virtual environments, your pupils dilate in direct response to the cognitive demands placed on your brain. Your pupil size serves as a precise biomarker, ranging from 2 to 8 mm depending on mental workload intensity.
As VR tasks become more challenging, your eye-tracking data reveals increasingly larger pupil diameters, providing researchers with quantifiable measurements of your cognitive processing demands.
This real-time physiological feedback allows developers to calibrate VR experiences appropriately. When your pupils show excessive dilation, it indicates potential cognitive overload, while minimal changes suggest insufficient engagement.
Pupil Size Measurement Accuracy
Accurate pupil size measurement forms the foundation for reliable cognitive load assessment in VR environments. When you’re evaluating user responses to virtual stimuli, precise tracking within the 2–8 mm range becomes essential for meaningful data collection. Your measurement accuracy directly impacts how effectively you can interpret cognitive demands and user engagement patterns.
Consider these critical factors for ideal pupil size measurement:
- Maintain consistent lighting conditions throughout VR sessions
- Calibrate eye tracking systems before each measurement period
- Account for individual baseline pupil size variations
- Monitor for artifacts caused by VR headset positioning
- Implement real-time validation protocols to guarantee data quality
You’ll find that measurement precision enables better understanding of how cognitive load fluctuates during different VR tasks, ultimately supporting the development of adaptive systems that respond appropriately to users’ mental states.
Immersive Environment Response Patterns
Since your VR system can now accurately measure pupil size, you’ll discover that pupil dilation serves as a powerful window into users’ cognitive and emotional responses to virtual environments.
You’ll notice significant dilation when users encounter high-arousal stimuli, directly correlating emotional intensity with visual engagement. Complex VR scenes will trigger greater pupil dilation as they demand more cognitive resources from your users.
Your eye-tracking technology enables real-time monitoring of these responses, revealing precisely where users focus their attention throughout the experience.
You can use pupil size as a reliable biomarker for content effectiveness—larger pupils indicate higher interest and immersion levels. This data helps you optimize VR design by identifying which elements capture attention most effectively, ensuring your virtual environments deliver maximum engagement.
Areas of Interest Performance Tracking
While examining overall gaze patterns provides valuable insights, you’ll gain more precise understanding by analyzing specific Areas of Interest (AOI) within your visual stimuli.
These eye tracking metrics reveal exactly how viewers engage with different components of your content.
Key AOI performance indicators include:
- Time to First Fixation – How quickly viewers notice specific elements
- Total Fixation Duration – Overall engagement time within each area
- Fixation Count – Number of times viewers return to examine regions
- Dwell Time – Sustained attention periods on particular components
- Entry and Exit Patterns – Navigation flows between different areas
High fixation counts and extended durations signal strong engagement and complexity, while brief interactions may indicate distraction.
Time to First Fixation Measurements
You’ll measure attention capture speed through Time to First Fixation (TTFF) data, which reveals how quickly viewers initially notice specific elements in your visual content.
When you analyze TTFF patterns across different Areas of Interest, you’re uncovering the visual priority hierarchy that guides your audience’s attention flow.
Shorter TTFF values indicate stronger immediate attraction, helping you identify which design elements successfully compete for viewers’ initial focus.
Attention Capture Speed
When you’re analyzing how quickly visual elements grab attention, Time to First Fixation (TTFF) becomes your most valuable measurement tool. You’ll discover that shorter TTFF values indicate immediate attention capture, while longer durations suggest your design isn’t compelling enough to draw viewers’ eye movements naturally.
TTFF reveals critical insights about visual effectiveness:
- Bottom-up factors like color contrast and brightness influence immediate attention
- Top-down factors including viewer expectations affect fixation patterns
- Demographic differences create varying attentional priorities across user groups
- Design clarity directly impacts how quickly viewers locate important content
- Prior knowledge shapes where users look first
You can leverage this metric to optimize advertising campaigns, website layouts, and visual communications by understanding exactly when viewers first engage with your content.
Visual Priority Patterns
Three distinct visual priority patterns emerge when you measure Time to First Fixation across different design elements.
Primary elements with immediate salience capture your First Fixation within 200-500 milliseconds, indicating strong bottom-up attention triggers.
Secondary elements show moderate Time to First Fixation values between 500-1500 milliseconds, suggesting they’re processed after initial scanning but still maintain visual importance.
Tertiary elements register longer delays, often exceeding 2000 milliseconds before receiving attention.
You’ll notice these patterns vary greatly based on visual hierarchy and design complexity.
High-contrast elements, strategic positioning, and familiar shapes typically achieve faster fixation times.
When analyzing each Area of Interest, you’re fundamentally mapping how viewers navigate visual information, revealing which design components successfully compete for attention and establishing clear priority sequences in visual processing.
Blink Rate Changes Under VR Conditions
As you immerse yourself in virtual environments, your natural blinking patterns undergo significant changes that reveal important insights about cognitive load and visual engagement.
Your blink rate typically drops by up to 50% compared to real-world settings as you become absorbed in virtual experiences. This reduction indicates heightened focus but also potential visual strain.
Monitoring these changes helps assess user comfort and performance effectiveness:
- Increased blink frequency correlates with higher stress levels
- Longer blink durations suggest visual strain from complex stimuli
- Significant deviations from baseline indicate cognitive workload shifts
- Reduced blinking shows deep engagement but risks eye fatigue
- Excessive strain decreases task execution effectiveness
Understanding these patterns enables optimization of VR experiences, ensuring sustained engagement without compromising your comfort or performance quality.
Visual Attention Heat Mapping
Visual attention heat mapping transforms your complex gaze data into intuitive, color-coded visualizations that reveal exactly where you’re looking and for how long.
These heatmaps use color gradients to represent gaze density, with red and yellow areas indicating high visual attention zones while cooler colors show neglected regions.
You can capture non-conscious attention processing by generating heatmaps within the first 500 milliseconds of stimulus presentation. This reveals your instantaneous eye movement patterns before deliberate cognitive processing begins.
You’ll discover significant variations when comparing individual responses against group data, highlighting personal preferences and universal attention patterns.
When you combine heatmaps with fixation count and duration metrics, you’ll gain thorough insights into viewer behavior, enabling precise identification of engaging visual elements and optimization strategies.
Eye Movement Coordination Between Eyes
While heatmaps reveal where your attention concentrates, understanding how your eyes work together provides deeper insights into visual processing efficiency.
Eye trackers measure binocular coordination to evaluate how effectively your visual system processes complex information. When your eyes don’t coordinate properly, you’ll experience visual confusion and decreased accuracy in tasks requiring depth perception.
Performance metrics reveal essential coordination patterns:
- Fixation disparities – differences in where each eye focuses on objects
- Average fixation duration – prolonged fixations indicating increased cognitive load
- Saccadic movement synchronization – coordination during rapid eye movements
- Pupil diameter variations – indicators of processing difficulty between eyes
- Response time delays – slower reactions from poor eye coordination
These measurements help identify coordination issues that impact your visual task performance and cognitive workload.
Cognitive Load Assessment Through Ocular Metrics
Beyond tracking where your eyes move, researchers can measure the mental effort you’re expending through subtle changes in your ocular behavior. Your pupil size serves as a real-time measure of cognitive load, dilating when you’re processing complex information or experiencing stress. This response provides valuable insights into human behavior during challenging tasks.
| Metric | Low Cognitive Load | High Cognitive Load | Practical Application |
|---|---|---|---|
| Pupil Diameter | 2-4 mm | 6-8 mm | Aviation training assessment |
| Fixation Duration | Brief, efficient | Extended processing | Healthcare procedure monitoring |
| Fixation Frequency | Fewer revisits | Multiple returns | Educational program optimization |
| Visual Scanning | Smooth patterns | Erratic movements | Performance intervention timing |
These measurements enable trainers and supervisors to identify when you’re reaching cognitive overload and implement timely interventions.
Frequently Asked Questions
What Does Eye Tracking Data Tell Us?
You’ll discover how your visual attention flows across content, revealing where you look first, how long you focus, and which elements capture your interest most effectively during viewing experiences.
What Does an Eye Tracker Measure?
An eye tracker measures where you’re looking by detecting your gaze points and pupil movements. It captures fixation duration, saccades, and blink patterns, providing precise data about your visual attention and scanning behavior.
What Are the Results of Eye Tracking?
You’ll get data showing where you looked, how long you focused on areas, and your gaze patterns. These results reveal attention distribution, engagement levels, and visual processing behaviors.
How Does Eye Tracking Measure Attention?
Eye tracking measures your attention by recording where you’re looking, how long you fixate on areas, and how quickly you notice elements, revealing your engagement patterns and cognitive processing.
In Summary
You’ll discover that eye tracking metrics provide powerful insights into your VR performance across multiple dimensions. By analyzing your fixation patterns, gaze movements, and pupil responses, you can identify cognitive bottlenecks and attention inefficiencies. Your saccadic velocity and blink rates reveal stress levels, while heat mapping shows where you’re focusing most. These ocular measurements give you objective data to optimize your virtual environment interactions and enhance overall task performance.


Leave a Reply